
Annual index results for Nova Scotia and Prince Edward Island (Atlantic Northern Forest (BCR 14))
- Species common name: Bobolink
- Scientific name: Dolichonyx oryzivorus
- Taxonomy family: Blackbirds, Grackles, Cowbirds, Orioles
- Geographic area: Nova Scotia and Prince Edward Island (Atlantic Northern Forest (BCR 14))
- Time period: Long-term
Note: the range of the vertical axis has been scaled to highlight pattern in the annual indices. If estimates are imprecise, the graph may not include the upper credible limits.
View definitions of the annual index table columns.
| Year | Annual index | Lower limit | Upper limit |
|---|---|---|---|
| 1970 | 18.1 | 14.8 | 22 |
| 1971 | 19.5 | 15.9 | 23.4 |
| 1972 | 21.5 | 17.7 | 25.5 |
| 1973 | 23.1 | 18.7 | 27.2 |
| 1974 | 25.3 | 20.6 | 30.4 |
| 1975 | 24.5 | 20 | 28.9 |
| 1976 | 24.9 | 20.3 | 29.4 |
| 1977 | 25.1 | 20.5 | 29.5 |
| 1978 | 25 | 20.2 | 29.5 |
| 1979 | 25.9 | 21.6 | 30.8 |
| 1980 | 26.3 | 22 | 31.2 |
| 1981 | 26.5 | 21.9 | 31.4 |
| 1982 | 26.3 | 21.8 | 31.3 |
| 1983 | 25.1 | 20.7 | 30.2 |
| 1984 | 23.2 | 19.3 | 27.5 |
| 1985 | 20.4 | 16.6 | 24 |
| 1986 | 17.9 | 14.6 | 21.1 |
| 1987 | 15 | 12.2 | 17.9 |
| 1988 | 13.2 | 10.8 | 15.8 |
| 1989 | 11.4 | 9.4 | 13.5 |
| 1990 | 10.5 | 8.8 | 12.5 |
| 1991 | 9.59 | 7.96 | 11.3 |
| 1992 | 8.41 | 7.08 | 10 |
| 1993 | 7.41 | 6.24 | 8.64 |
| 1994 | 6.62 | 5.6 | 7.74 |
| 1995 | 5.82 | 4.9 | 6.8 |
| 1996 | 5.09 | 4.29 | 5.91 |
| 1997 | 4.33 | 3.69 | 5.04 |
| 1998 | 3.75 | 3.13 | 4.35 |
| 1999 | 3.2 | 2.63 | 3.71 |
| 2000 | 2.95 | 2.45 | 3.44 |
| 2001 | 2.68 | 2.27 | 3.16 |
| 2002 | 2.5 | 2.1 | 2.95 |
| 2003 | 2.34 | 1.94 | 2.75 |
| 2004 | 2.18 | 1.84 | 2.58 |
| 2005 | 2.04 | 1.71 | 2.41 |
| 2006 | 1.98 | 1.65 | 2.35 |
| 2007 | 1.86 | 1.55 | 2.19 |
| 2008 | 1.77 | 1.43 | 2.07 |
| 2009 | 1.62 | 1.34 | 1.88 |
| 2010 | 1.55 | 1.27 | 1.82 |
| 2011 | 1.49 | 1.21 | 1.76 |
| 2012 | 1.38 | 1.12 | 1.63 |
| 2013 | 1.38 | 1.14 | 1.65 |
| 2014 | 1.27 | 1.05 | 1.52 |
| 2015 | 1.22 | 0.989 | 1.46 |
| 2016 | 1.1 | 0.916 | 1.35 |
| 2017 | 1.03 | 0.847 | 1.27 |
| 2018 | 0.958 | 0.755 | 1.16 |
| 2019 | 0.887 | 0.692 | 1.09 |
| 2020 | 0.812 | 0.616 | 1.04 |
| 2021 | 0.752 | 0.543 | 0.96 |
Geographic area included in the Long-term trend for the Bobolink
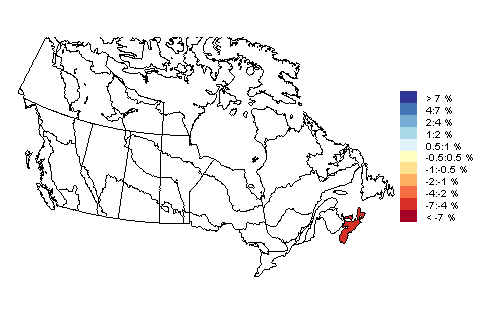
Bird Conservation Regions (BCR) with data included in Long-term trend estimates for Nova Scotia and Prince Edward Island (Atlantic Northern Forest (BCR 14))
- Nova Scotia and Prince Edward Island (Atlantic Northern Forest (BCR 14))
This web site may be cited as: Smith, A.C., Hudson, M-A.R. Aponte, V.I., English, W.B., and Francis, C.M. 2023. North American Breeding Bird Survey - Canadian Trends Website, Data-version 2021. Environment and Climate Change Canada, Gatineau, Quebec, K1A 0H3
Any use of these BBS results for Canada should acknowledge the hundreds of skilled volunteers in Canada who have participated in the BBS over the years and those who have served as provincial or territorial coordinators for the BBS.
- Smith, A. C., & Edwards, B. P. M. (2020). North American Breeding Bird Survey status and trend estimates to inform a wide range of conservation needs, using a flexible Bayesian hierarchical generalized additive model. The Condor, duaa065. https://doi.org/10.1093/ornithapp/duaa065